
Microsoft SQL Server
PIVOT
In Microsoft SQL Server, the PIVOT operator is used to transform rows of data into columns. It allows you to rotate or pivot your data, making it easier to generate summary reports and analyze data in a more intuitive, tabular format. For beginners, learning how to use the PIVOT operator helps you convert data from a long format to a more readable wide format, which is particularly useful for creating cross-tab reports.
Below is a detailed explanation of how to use the PIVOT operator with examples and best practices.
1. Basic Syntax of PIVOT
The PIVOT operator requires three main components:
- The aggregation function (such as
SUM,COUNT, etc.) to apply. - The column whose values will become the column headers in the final result.
- The column whose values will be aggregated.
SELECT column_list
FROM (SELECT column_name(s)
      FROM table_name) AS SourceTable
PIVOT (
    aggregate_function(column_to_aggregate)
    FOR column_to_pivot IN (column1, column2, ..., columnN)
) AS PivotTable;
Example:
SELECT Category, [2023], [2024]
FROM (SELECT ProductName, Category, Year, SalesAmount
      FROM Sales) AS SourceTable
PIVOT (
    SUM(SalesAmount)
    FOR Year IN ([2023], [2024])
) AS PivotTable;
This query pivots the Year column and sums the SalesAmount for each year. The resulting table shows Category as rows and sales amounts for the years 2023 and 2024 as columns.
2. Using PIVOT for Sales Data
Let's use a practical example to pivot sales data by category and year.
SELECT ProductName, [2023], [2024]
FROM (SELECT ProductName, Year, SalesAmount
      FROM Sales) AS SourceTable
PIVOT (
    SUM(SalesAmount)
    FOR Year IN ([2023], [2024])
) AS PivotTable;
In this query, product names are listed as rows, while sales amounts for 2023 and 2024 are displayed as columns. The SUM function aggregates sales for each product and year.
3. Using PIVOT with COUNT()
You can also use PIVOT with the COUNT() function to count occurrences, such as counting how many times a product was sold each year.
SELECT ProductName, [2023], [2024]
FROM (SELECT ProductName, Year, SaleID
      FROM Sales) AS SourceTable
PIVOT (
    COUNT(SaleID)
    FOR Year IN ([2023], [2024])
) AS PivotTable;
This query counts how many sales each product had in the years 2023 and 2024.
4. Adding GROUP BY in a PIVOT
In some cases, you may need to group the data before applying the PIVOT. For example, to aggregate data by category:
SELECT Category, [2023], [2024]
FROM (SELECT Category, Year, SalesAmount
      FROM Sales) AS SourceTable
PIVOT (
    SUM(SalesAmount)
    FOR Year IN ([2023], [2024])
) AS PivotTable;
This query aggregates sales by Category and pivots the data for 2023 and 2024.
5. Best Practices for Using PIVOT
Use Aliases for Clarity – Always use table aliases (
AS SourceTableandAS PivotTable) to make your query more readable and maintainable.SELECT Category, [2023], [2024] FROM (SELECT Category, Year, SalesAmount FROM Sales) AS SourceTable PIVOT ( SUM(SalesAmount) FOR Year IN ([2023], [2024]) ) AS PivotTable;Ensure Column Names are Consistent – The values you want to pivot (like years or categories) must be consistent in the data. Any missing values in the
INclause will result in missing columns.Apply
GROUP BYBefore Pivoting When Needed – If you're working with data that requires grouping before pivoting (e.g., grouping sales by category), make sure to applyGROUP BYor appropriate subqueries.SELECT ProductName, [2023], [2024] FROM (SELECT ProductName, Year, SalesAmount FROM Sales) AS SourceTable PIVOT ( SUM(SalesAmount) FOR Year IN ([2023], [2024]) ) AS PivotTable;Use Aggregates Wisely – The
PIVOToperation requires an aggregate function. Choose the correct aggregate for your needs (e.g.,SUMfor totals,COUNTfor frequencies).Test Data for Missing Values – Be aware that if there are no matching values for a column in the
PIVOToperation,NULLwill be returned for that column. Consider how you want to handle missing data.
By mastering the PIVOT operator, you can transform and summarize your data in a more structured and readable format, making it easier to generate reports and perform analyses in Microsoft SQL Server.
To gain complete access, login with gmail or outlook, no need of signup, click here

SQL PIVOT TECHNIQUE
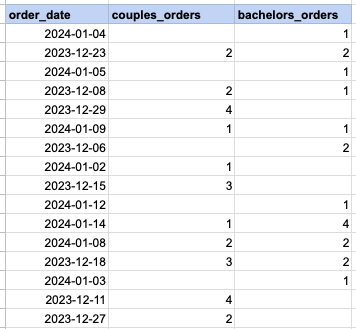
Let's delve into the specifics of implementing the pivot technique across different SQL databases like MySQL, PostgreSQL, Oracle, and Microsoft SQL Server. In our example, we aim to utilize the SQL pivot method to organize daily order counts, distinguishing between orders placed by couples and those by bachelors.
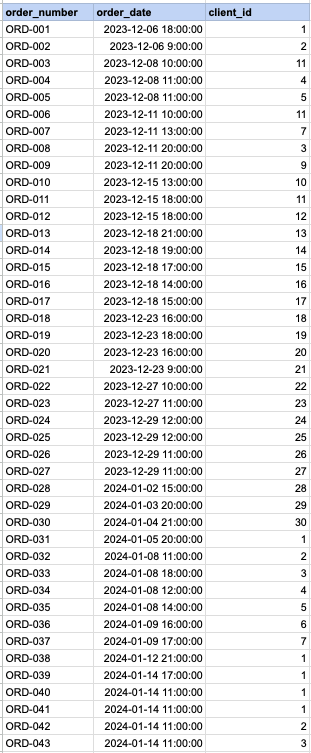
Raw data from order table
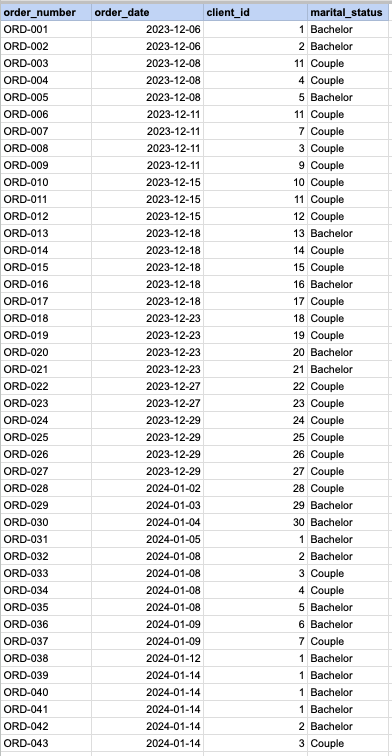
Step1, Get client's marital status
Utilize below query to merge the 'Orders' table with the 'Clients' table, thereby obtaining the marital status of clients from the 'Clients' table. Additionally, transform the 'OrderDateTime' into just the 'OrderDate'.
SELECT a.order_number, DATE(a.order_date), a.client_id ,CASE WHEN b.married_flag = 1 THEN 'Married' ELSE 'Single' END AS marital_status FROM act_order a INNER JOIN org_client b on b.client_id = a.client_id order by order_id;Step 1 output
MySQL and PostGreSQL PIVOT technique
SELECT DATE(a.order_date) as order_date ,SUM(CASE WHEN b.married_flag = 1 THEN 1 END) AS couples_orders ,SUM(CASE WHEN b.married_flag = 0 THEN 1 END) AS bachelors_orders FROM act_order a INNER JOIN org_client b on b.client_id = a.client_id GROUP BY DATE(a.order_date);MS SQL SERVER PIVOT technique
SELECT * FROM (SELECT CONVERT(DATE, a.order_date) as order_date , a.client_id ,CASE WHEN b.married_flag = 1 THEN 'Married' ELSE 'Single' END AS marital_status FROM act_order a INNER JOIN org_client b on b.client_id = a.client_id ) t PIVOT( COUNT(client_id) FOR marital_status IN ( [Married], [Single]) ) AS pivot_table;Oracle PIVOT technique
SELECT * FROM (SELECT TO_CHAR(a.order_date,'DD/MM/YY') as order_date , a.client_id ,CASE WHEN b.married_flag = 1 THEN 'Married' ELSE 'Single' END AS marital_status FROM act_order a INNER JOIN org_client b on b.client_id = a.client_id ) t PIVOT( COUNT(client_id) FOR marital_status IN ('Married','Single') )FINAL OUTPUT
Comments Not Found