
Microsoft SQL Server
Chapter 7 - DQL (Data Query Language)
DQL Assignment 4 - MS SQL Logic for Dashboard Reporting in a Food Delivery System
Objective:
This assignment focuses on designing SQL queries for dashboard reporting in a Food Delivery System using the provided DDL tasks. The goal is to generate insights related to customers, orders, restaurants, and delivery agents for dashboard data visualization.
Requirements:
- Write SQL queries to extract data for various dashboard metrics.
- Generate key visuals such as bar charts, pie charts, and tables supported by SQL queries.
- Note: Students must complete their DDL and DML assignments from the previous chapter to use the tables and data required for this assignment.
Assignment Tasks:
1. Customer Overview
- Metrics:
- Total number of customers.
- List of customers with email and address.
- Number of orders per customer.
SQL Queries:
- Count total customers.
- Retrieve customer details (name, email, address).
- Retrieve the number of orders for each customer (join
CUSTOMERandORDER).
2. Restaurant Overview
- Metrics:
- Total number of restaurants.
- Restaurants by location.
- Popular restaurants by total number of orders.
SQL Queries:
- Count total restaurants.
- Retrieve restaurant names grouped by location.
- Retrieve popular restaurants based on the number of orders (join
RESTAURANTandORDER).
3. Order Overview
- Metrics:
- Total number of orders.
- Recent orders (last 3 months).
- Orders by status (Pending, Delivered, Cancelled).
SQL Queries:
- Count total orders.
- Retrieve recent orders.
- Retrieve orders grouped by status.
4. Menu Item Overview
- Metrics:
- Popular menu items by order frequency.
- Menu items by restaurant.
- Average price of menu items by restaurant.
SQL Queries:
- Retrieve popular menu items.
- Retrieve menu items grouped by restaurant (join
MENU_ITEMandRESTAURANT). - Retrieve the average price of menu items for each restaurant.
5. Delivery Overview
- Metrics:
- Total deliveries per delivery agent.
- Recent deliveries (last month).
- Delivery status (In Transit, Delivered).
SQL Queries:
- Retrieve the number of deliveries per delivery agent.
- Retrieve recent deliveries.
- Retrieve deliveries grouped by status.
6. Audit Log Overview
- Metrics:
- Actions performed by customers.
- System changes related to orders.
- Number of logs per day.
SQL Queries:
- Retrieve recent actions performed by customers.
- Retrieve system changes related to orders.
- Count the number of logs per day.
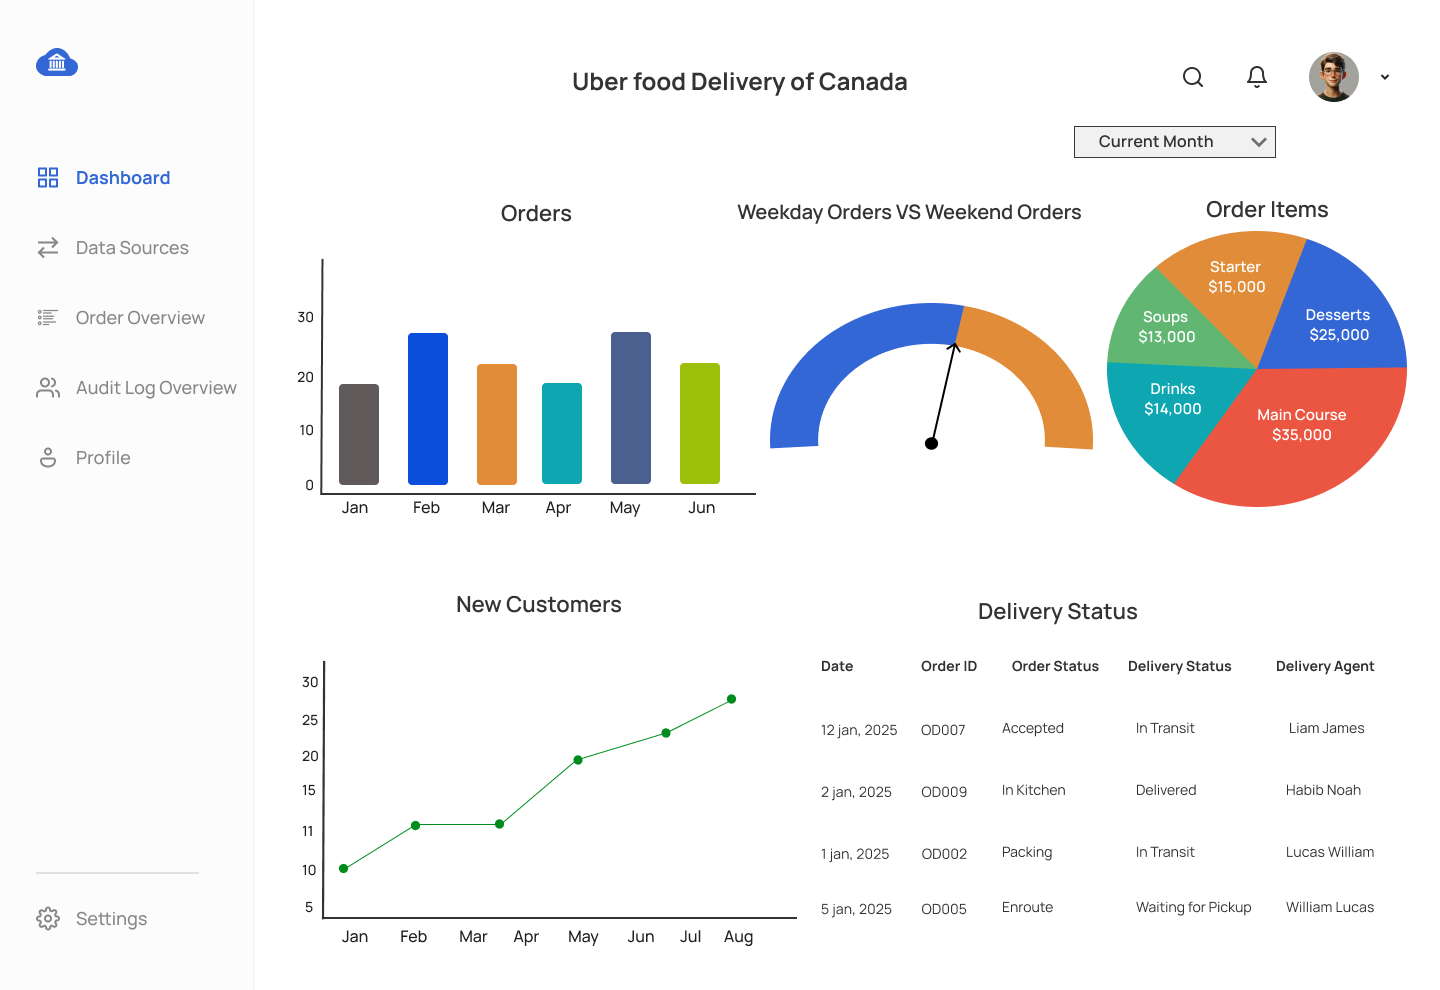
Key Visuals and Corresponding SQL Queries:
Note: All dashboard queries must work against current month or current year filters
Bar Chart - Orders by Customer
- SQL Query: Retrieve the total number of orders per customer.
- X-Axis: Customer names.
- Y-Axis: Number of orders.
Pie Chart - Revenue by Menu Category
- SQL Query: Retrieve revenue per menu category.
- Pie Sections: Status and order count.
Line Graph - New Customers by Month
- SQL Query: Retrieve the number of new customers per month.
- X-Axis: Registration date (grouped by month).
- Y-Axis: Number of new customers.
Table - Delivery Status
- SQL Query: Retrieve order id, order sttus, delivery status, and delivery agent.
Gauge - Total Orders
- SQL Query: Count the total number of orders in the system.
- Display: Total order count.
Submission Details:
- Write all SQL queries in a single SQL file.
- Ensure each query is numbered sequentially for clarity.
- Name the file:
dashboard_reporting_food_delivery_project.sql. - Submit the file in an organized format, making it easy to follow and understand.
This assignment helps students practice writing SQL queries to generate insights from a Food Delivery System, extracting data related to customers, restaurants, orders, and delivery logistics, suitable for building interactive dashboards.
UX Screens for Food Delivery System Dashboard Mockup
Comments Not Found