
MySQL
DQL Assignment 4 - MySQL Logic for Dashboard Reporting in a Student Management System
Objective:
This assignment focuses on creating SQL queries for dashboard reporting in a Student Management System using the tables defined in chapter 5 DDL assignment. The goal is to retrieve insights related to students, courses, enrollments, attendance, and system logs, generating meaningful visualizations for the dashboard.
Requirements:
- You will need to filter the output results for the current semester.
- Write SQL queries to extract data for various metrics required for the dashboard.
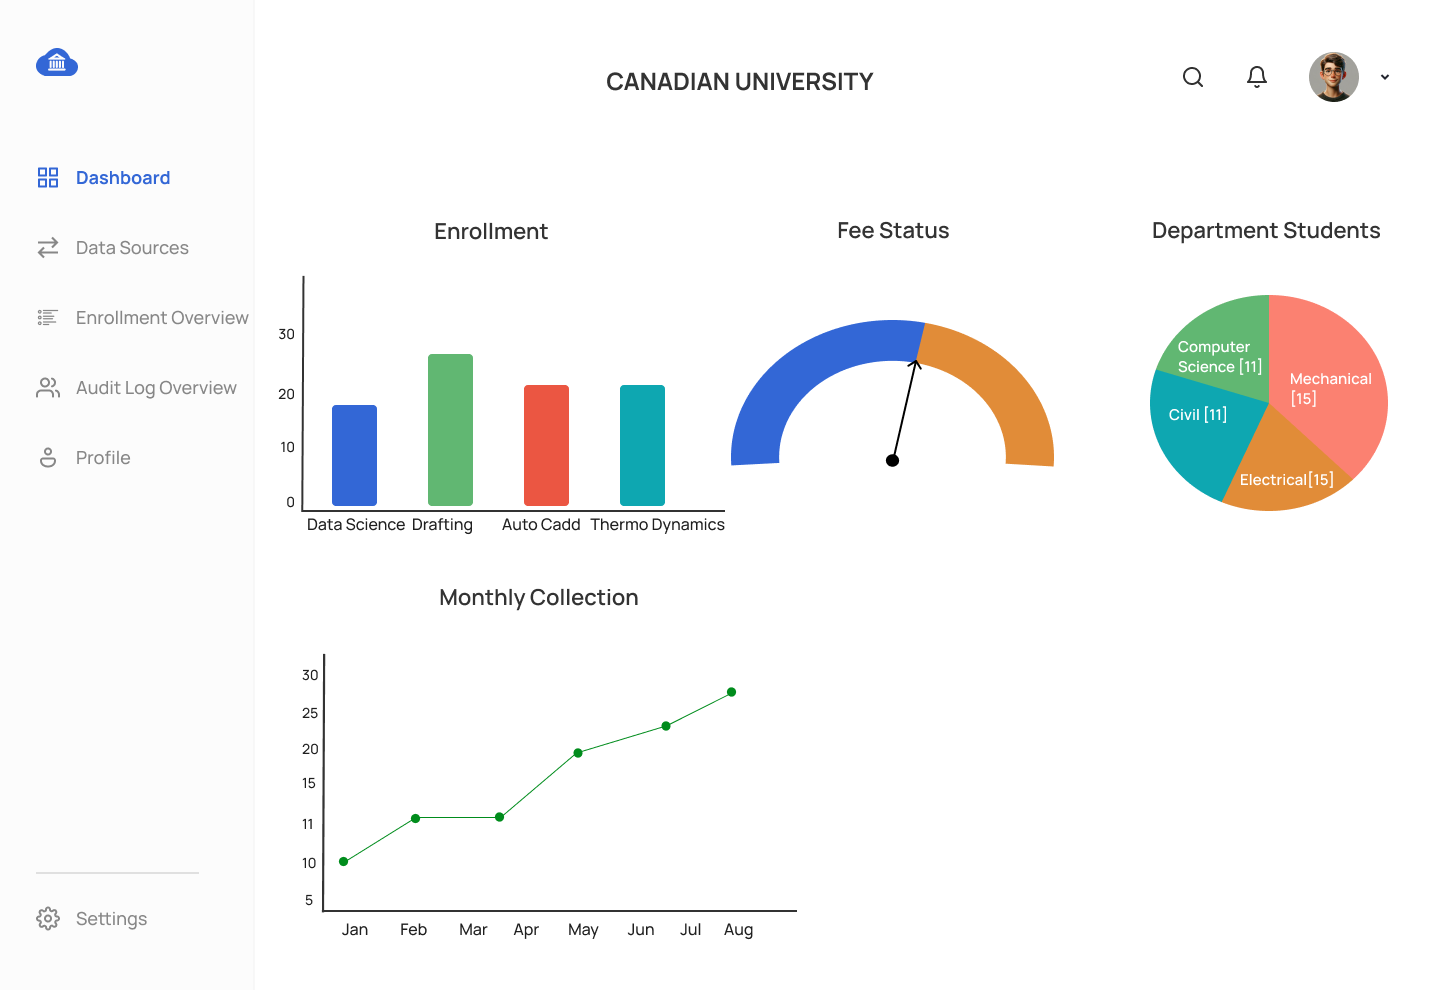
- Key visuals like bar charts, pie charts, line graphs, and tables should be supported by the SQL queries.
- Note: Students must complete their DDL and DML assignments from the previous chapter to use the tables and data required for this assignment.
Assignment Tasks:
1. Student Overview
- Metrics:
- Total number of students.
- List of students with date of birth and email.
- Number of students enrolled in each course.
SQL Queries:
- Count total students.
- Retrieve student names, date of birth, and email.
- Retrieve student count per course (join
STUDENTandENROLLMENT).
2. Course Overview
- Metrics:
- Total number of courses.
- Average credits per course by department.
- Courses with high and low enrollments.
SQL Queries:
- Count total courses.
- Retrieve average credits per department.
- List courses with high and low student enrollments (join
COURSE,ENROLLMENT, andDEPARTMENT).
3. Enrollment Overview
- Metrics:
- Number of students enrolled per course.
- Recent enrollments (within the last 6 months).
- Students who failed to pass a course (grade < 'D').
SQL Queries:
- Retrieve enrollments per course.
- List recent enrollments by checking the
enrollment_date. - List students who received failing grades based on the
gradein theENROLLMENTtable.
4. Teacher Overview
- Metrics:
- Total number of teachers.
- Teacher-course assignments (how many courses per teacher).
- Teacher hire dates.
SQL Queries:
- Count total teachers.
- Retrieve teacher names and the number of courses they teach (join
TEACHERandTEACHER_COURSE). - List teachers hired over time (grouped by month using the
hire_date).
5. Exam Overview
- Metrics:
- Number of exams per course.
- Exams with total marks greater than 100.
- Exams conducted in the last year.
SQL Queries:
- Count the number of exams per course (join
EXAMandCOURSE). - Retrieve exams where total marks are greater than 100.
- List all exams conducted in the last year.
6. Attendance Overview
- Metrics:
- Attendance per course (how many students were present or absent).
- Students who have more than 5 absences in a course.
- Overall attendance rate.
SQL Queries:
- Retrieve the number of students marked 'Present' and 'Absent' per course (use the
ATTENDANCEtable). - List students with more than 5 absences in any course.
- Calculate the overall attendance rate by dividing total presents by the total attendance records.
7. Audit Log Overview
- Metrics:
- List of recent system changes.
- Changes made by teachers.
- Number of changes logged per day.
SQL Queries:
- Retrieve recent actions from the
AUDIT_LOGtable. - Retrieve actions performed by teachers by joining
AUDIT_LOGwithTEACHER. - Count the number of audit logs per day.
Key Visuals and Corresponding SQL Queries:
Note: All dashboard queries must work against current month or current year filters
Bar Chart - Enrollment by Course
- SQL Query: Retrieve the number of students enrolled in each course.
- X-Axis: Course names.
- Y-Axis: Number of students.
Pie Chart - Department Students
- SQL Query: Retrieve the number of students enrolled for each department.
Line Graph - Monthly Collectionsh
- SQL Query: Retrieve total fees collected per month.
- X-Axis: Collection date (grouped by month).
- Y-Axis: Collection Amount.
Table - Exam Result by Courses
- SQL Query: Retrieve course name, exam name, enrolled count, passed count and failed count.
- Columns: Course, Exam Name, Student Count, Passed Count, Failed Count.
Gauge - Fees Status
- SQL Query: Retrieve total fees, paid amount and due amount for current semester.
- Display: Total paid fees and due amount.
Submission Details:
- Write down all SQL queries in a single SQL file.
- Ensure each query is numbered sequentially within the file for clarity.
- Name your file using the format:
dashboard_reporting_student_management_project.sql. - Submit the file as part of the assignment, and ensure it is organized and easy to follow.
This assignment allows students to practice SQL queries to generate reports and dashboard insights from the Student Management System. The task involves using real-world data to create meaningful reports and visualizations based on the database structure.
To gain complete access, login with gmail or outlook, no need of signup, click here
UX Screens for Student Management System Dashboard Mockup
Comments Not Found