
Oracle
Chapter 7 - DQL (Data Query Language)
DQL Assignment 4 - Oracle SQL Logic for Dashboard Reporting in a Facebook Application
Objective:
This assignment focuses on designing SQL queries for dashboard reporting in a Facebook-like Social Media Application using the provided DDL tasks. The goal is to generate insights related to users, posts, friendships, reactions, and system logs for use in visualizing dashboard data. Students are required to utilize the tables created during the Chapter 5 DDL assignment.
Requirements:
- Write SQL queries to extract data for various dashboard metrics.
- Generate key visuals like bar charts, pie charts, and tables, supported by SQL queries.
- Note: Students must complete their DDL and DML assignments from the previous chapter to use the tables and data required for this assignment.
Assignment Tasks:
1. User Overview
- Metrics:
- Total number of users.
- List of users with email and date of birth.
- Number of friends per user.
SQL Queries:
- Count total users.
- Retrieve user names, email, and date of birth.
- Retrieve the number of friends for each user (join
USERandFRIEND).
2. Post Overview
- Metrics:
- Total number of posts.
- Recent posts (created in the last 6 months).
- Posts with the highest number of reactions.
SQL Queries:
- Count total posts.
- Retrieve recent posts using the
created_attimestamp. - Retrieve posts sorted by the highest number of reactions (join
POSTandREACTION).
3. Friendship Overview
- Metrics:
- Number of friendships (accepted, pending, blocked).
- Recent friend requests (last 3 months).
- Friends by status (accepted/pending/blocked).
SQL Queries:
- Retrieve friendships by status.
- List recent friend requests using
statusandfriendship_id. - Retrieve total friends grouped by friendship status.
4. Reaction Overview
- Metrics:
- Total reactions on posts.
- Reactions by type (Like, Love, Haha).
- Reactions grouped by user.
SQL Queries:
- Count total reactions on posts.
- Retrieve reactions grouped by type.
- Retrieve user reactions grouped by user (join
REACTIONandUSER).
5. Page Overview
- Metrics:
- Total number of pages.
- Pages by owner.
- Recently created pages (within the last 3 months).
SQL Queries:
- Count the total number of pages.
- Retrieve pages grouped by their owner (join
PAGEandUSER). - Retrieve recently created pages using the
created_attimestamp.
6. Audit Log Overview
- Metrics:
- Recent actions by users.
- Changes in posts and comments.
- Number of system logs per day.
SQL Queries:
- Retrieve recent actions from the
AUDIT_LOG. - Retrieve all changes made to posts or comments (use triggers and log changes).
- Count the number of logs grouped by day.
Key Visuals and Corresponding SQL Queries:
Note: All dashboard queries must work against current month or current year filters
Bar Chart - Posts by Month
- SQL Query: Retrieve the total number of posts created by each month.
- X-Axis: Month names.
- Y-Axis: Number of posts.
Pie Chart - Reaction Types
- SQL Query: Retrieve the count of different reaction types (Like, Love, Haha, etc.).
- Pie Sections: Reaction types and their counts.
Line Graph - User Signups by Month
- SQL Query: Retrieve the number of users registered per month.
- X-Axis: Registration date grouped by month.
- Y-Axis: Number of signups.
Table - Friendship Status Summary
- SQL Query: Retrieve friendship status, user names, and total friendships per status.
- Columns: User Name, Friend Name, Status.
Gauge - Total Posts vs Comments
- SQL Query: Count the total number of posts and comments in the system.
- Display: Total post count.
Submission Details:
- Write all SQL queries in a single SQL file.
- Ensure each query is numbered sequentially for clarity.
- Name the file:
dashboard_reporting_facebook_project.sql. - Submit the file in an organized format, making it easy to follow and understand.
This assignment challenges students to practice SQL queries to generate data insights from a Facebook-like Social Media System, helping build dashboards to track user engagement, reactions, friendships, and posts.
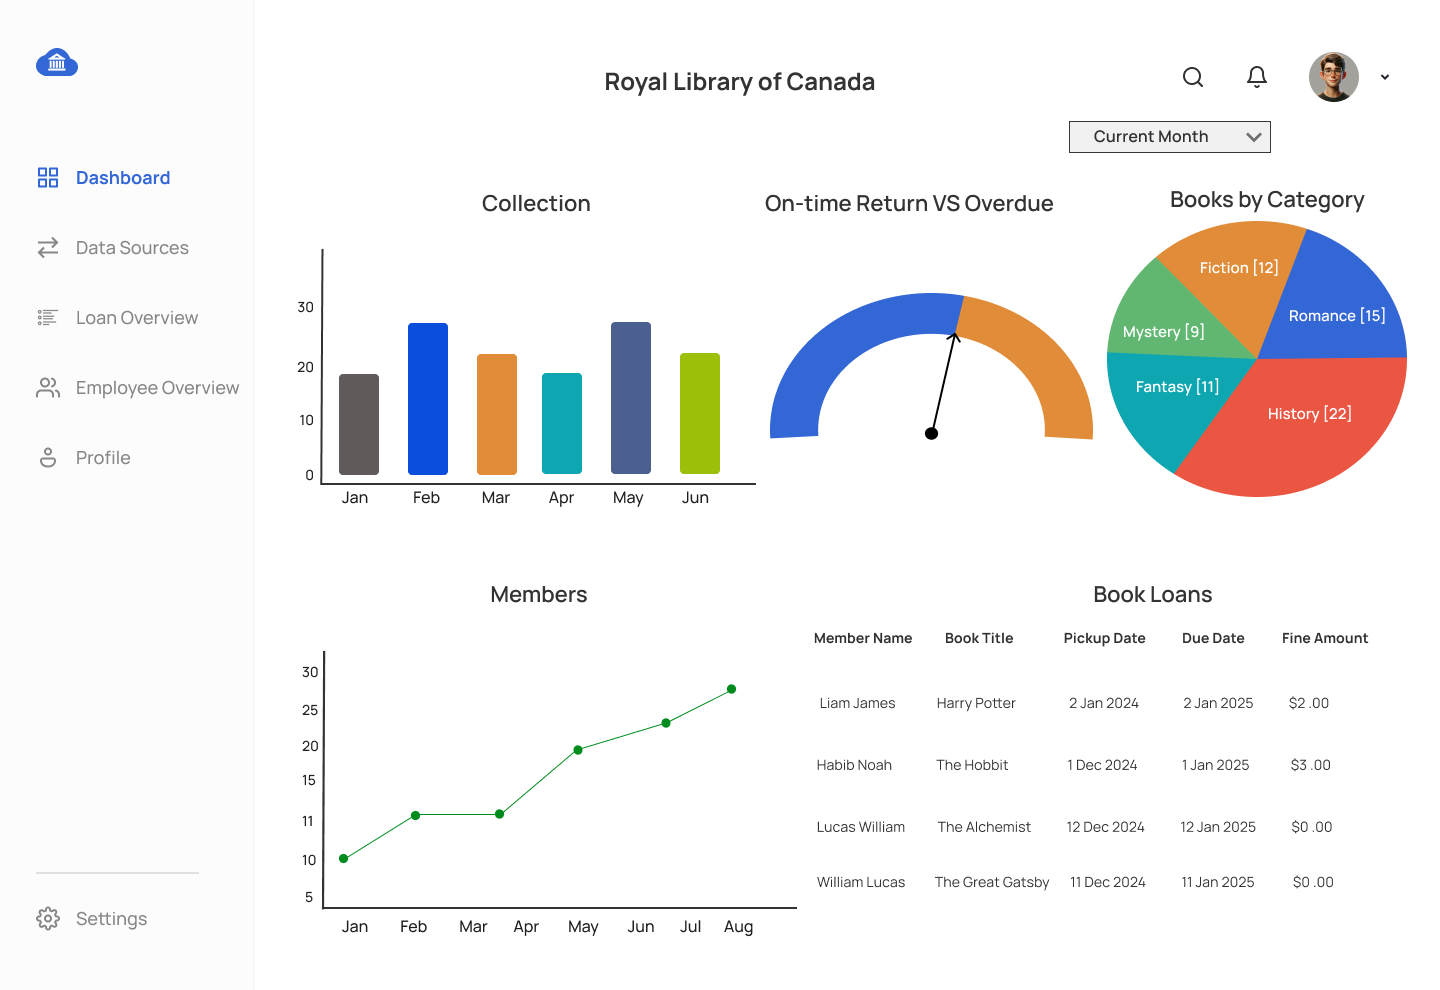
UX Screens for Library Management System Dashboard Mockup
Comments Not Found